How to Test Computer Vision Systems (Part 2 of 2)
By Dr. Zain Masood
Part 2: Evaluation
In part one we talked about test data annotation and in part two we talk about test data evaluation. We will be discussing fundamental metrics used to evaluate and compare computer vision systems such as accuracy, recall and precision. We will cover evaluations of the two main branches of computer vision: classification and detection.
Test Data Evaluation
Once we have both the test data and annotations finalized, we can turn our attention towards the computer vision system evaluation. The two key points when evaluating a computer vision system are metric definition/selection and evaluation criteria.
Metric Definition/Selection
Below we define the metrics used to evaluate and compare computer vision systems. Depending on the requirements, each of these metrics can be used separately or together for evaluation. Before we discuss these metrics, we need to explain a few key concepts that are essential for calculation.
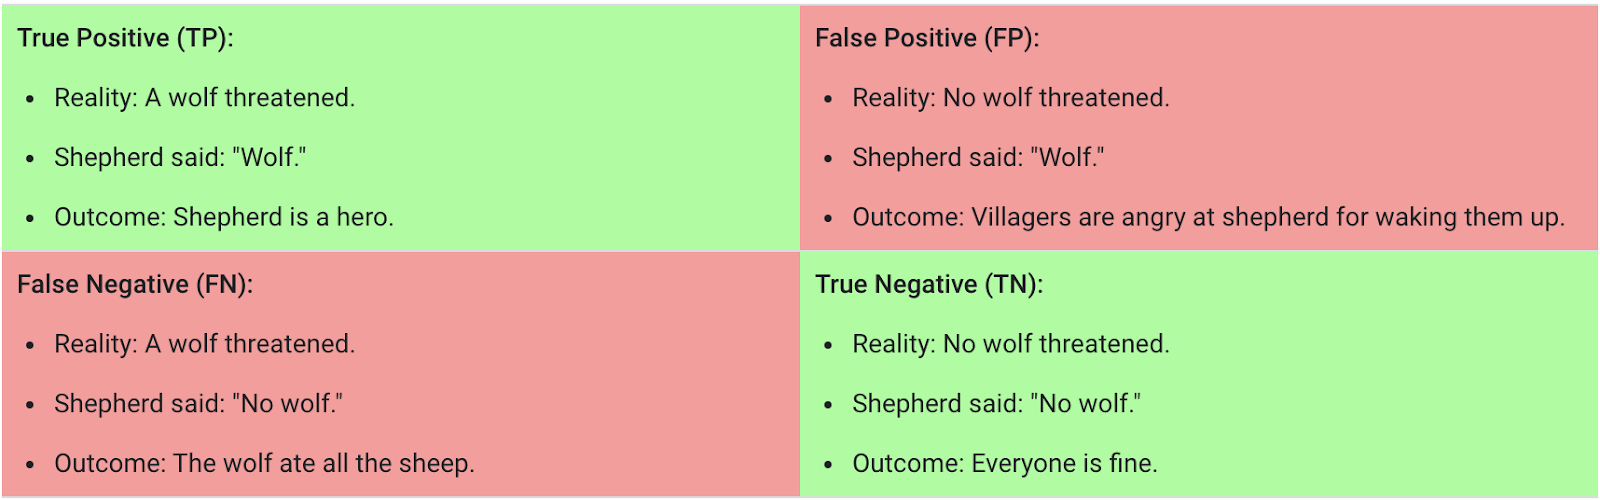
True Positive (TP): A true positive is an outcome where the model correctly predicts the presence of a class in the data
True Negative (TN): A true negative is an outcome where the model correctly predicts the absence of a class from the data
False Positive (FP): A false positive is an outcome where the model incorrectly predicts the presence of a class in the data
False Negative (FN): A false negative is an outcome where the model incorrectly predicts the absence of a class from the data
The following figure illustrates each of the above concepts
Accuracy
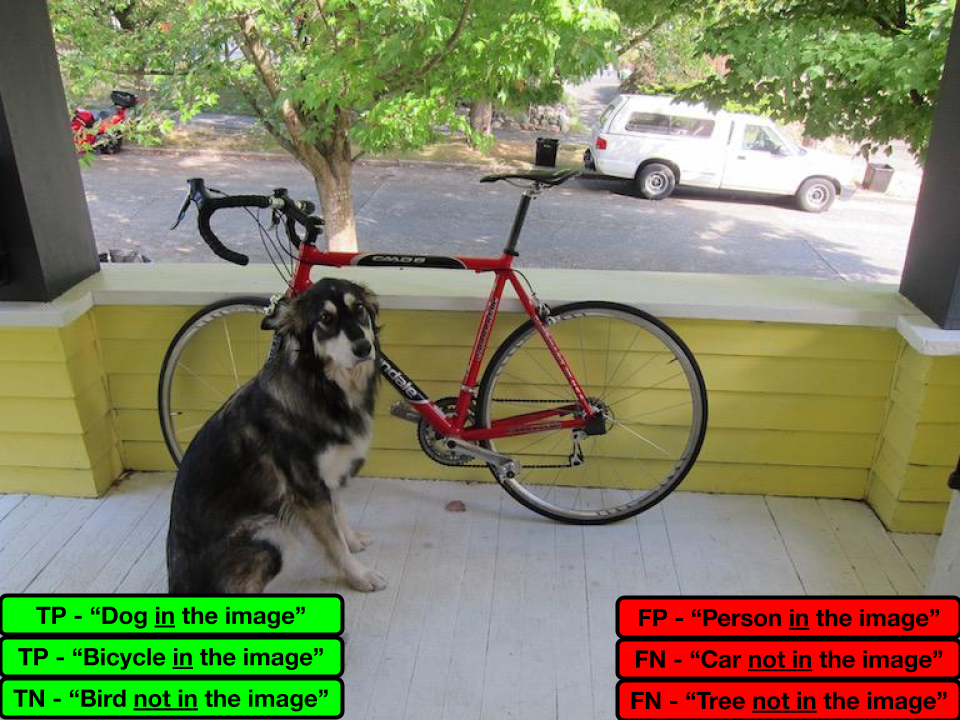
One of the fundamental metrics used across computer vision systems is accuracy. Accuracy is simply defined as the ratio of correct responses to the total number of test scenarios. A correct response is when the system correctly predicts the presence (TP) or absence (TN) of an object/concept in the data. As an example, the accuracy of the image below would be 0.50

Precision & Recall
Even though the accuracy number provides a good metric of how well the system is performing, it does bundle the different types of correct responses into one. Hence, it stops short of providing details on:
Impact of erroneously predicting something when it is not there (FP)
Impact of erroneously missing something that is there (FN)
This level of detail can at times be useful for use cases where one of FP or FN is preferred over the other. For example, when redacting a video for privacy concerns, it is more important not to miss identifiable objects (FN) than to over-redact (FP).
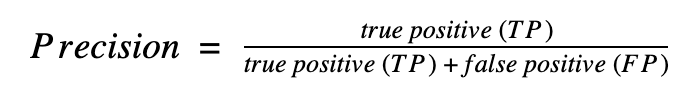
Precision
Precision is the metric defined to evaluate how a system performs with respect to false positive (FP). In other words, it is the ratio of the correct responses (TP) against the total predictions (TP + FP). As an example, the precision of the above image would be 0.67
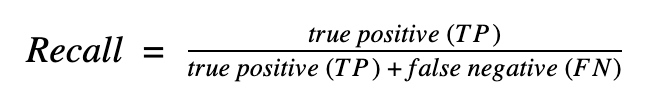
Recall
Recall is the metric defined to evaluate how a system performs with respect to false negatives (FN). In other words, it is the ratio of the correct responses (TP) against the total expected (TP + FN). As an example, the recall of the above image would be 0.5
Evaluation Criteria
The evaluation of a computer vision system is dependent on the task it performs. In this paper, we will cover evaluations of the two main branches of computer vision: classification and detection. Evaluation for each of these tasks are similar but have nuances that one needs to be aware of for accurate reporting.
Classification Evaluation
As mentioned above, a classification task revolves around identifying and associating appropriate labels/tags to the data. Hence, evaluating a classification system requires one to perform label/tag matches between system inference and annotation. This evaluation can be performed per category and then aggregated across all categories for an overall score.
Detection Evaluation
The detection task is similar to the classification task in the sense that it carries the same labeling/tagging requirement for visual data (image/video). Where it differs is that detection not only provides information on what is present in the image but also where it is present in the image. In other words, a detection system needs to be evaluated based on both the labeling as well as location of the objects present in the data.
The criteria for labeling is the same: find the number of label matches against the annotation. For location however, the success criteria is dependent on how perfectly the inference location and size fit the object bounding box defined in the annotation. We need to keep in mind that multiple/duplicate boxes on the same object count towards the FP (as shown below). As a general rule, a minimum 50% overlap between the inferred and annotation bounding boxes is considered a successful detection.
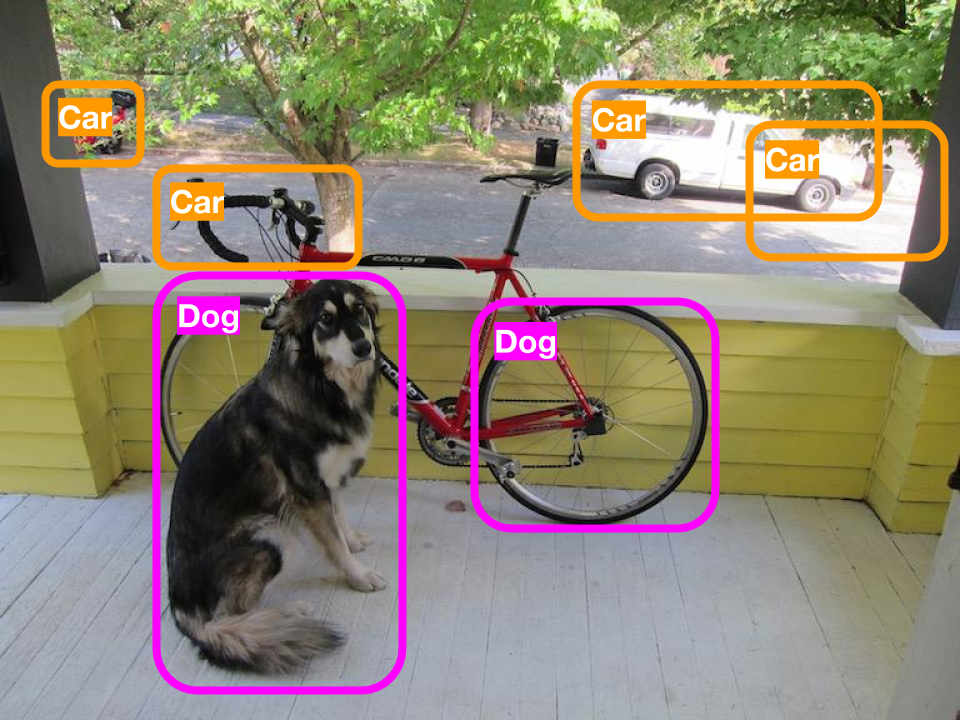
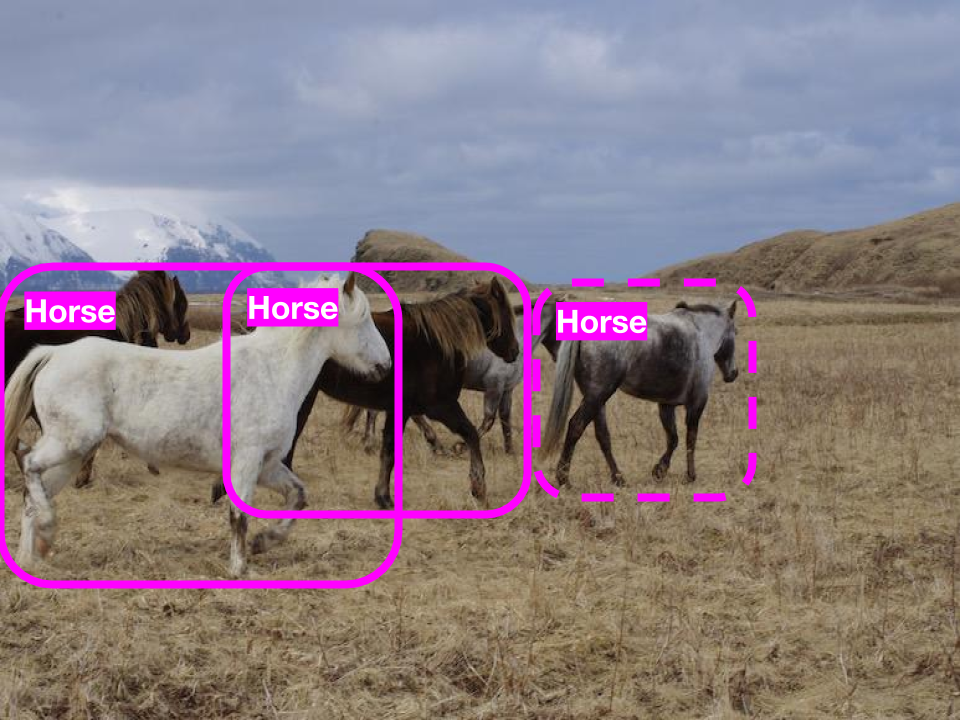
Below are two examples of precision and recall when evaluating a detection system.
In the first image, we see a total of 2 TP and 4 FP. Hence the overall detection precision for this image comes out to 0.33
In the second image, we 2 TP and 1 FN (dotted box indicated we missed the detection). Hence the overall recall for this image comes out to 0.67
Conclusion
The two key points when evaluating a computer vision system are metric definition/selection and evaluation criteria. Accuracy, recall and precision define the metrics used to evaluate and compare computer vision systems. Accuracy is simply defined as the ratio of correct responses to the total number of test scenarios. Evaluations criteria contains two main branches of computer vision, classification and detection. Classification task revolves around identifying and associating appropriate labels/tags to the data. Detection systems however, need to be evaluated based on both the labeling as well as location of the objects present in the data.